Population decreased at the rate of 0.09 percent annually
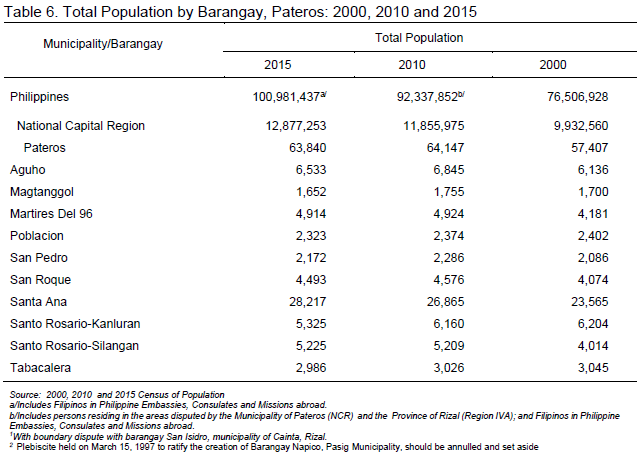
The municipality of Pateros, the only remaining municipality in the National Capital Region, had a total population of 63,840 persons as of August 1, 2015, a decrease of 307 persons over its total population of 64,147 persons in May 1, 2010. The decrease in the population translated into an average growth rate (PGR) of -0.09 percent annually during the period 2010 to 2015, which is 1.21 percent lower than the annual PGR of the municipality for the period 2000 to 2010.

Santa Ana was the most populous barangay
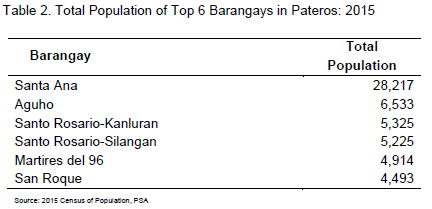
Among the 10 barangays comprising the municipality of Pateros, Barangay Santa Ana was the most populous. Its population size was 44.20 percent of the total population of the municipality. Aguho came in second in terms of population size, with 10.23 percent share. This was followed by Santo Rosario-Kanluran with 8.34 percent, Santo Rosario-Silangan with 8.18 percent, Martires del 96 with 7.70 percent and San Roque with 7.04 percent share. The rest of the barangays contributed less than 5.00 percent each.
The least populated barangay was Magtanggol with 2.59 percent share to the total population of the municipality with 1,652 persons residing in the barangay. This was 5.87 percent lower than recorded in the 2010 Census of Population and Housing (CPH).
The following table presents the total population of the top 6 barangays in Pateros.
Household population decreases by 0.59 percent
The total household population of the municipality of Pateros reached 63,643 persons in 2015, posting a decrease of 0.59 percent compared to 64,020 persons in 2010. Household population accounted for 99.69 percent of the municipality total population.
Population density decreases by 0.5 percent
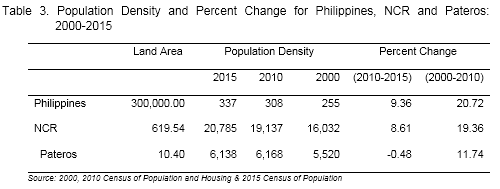
With land area of 10.40 square kilometers, the population density of the municipality of Pateros registered 6,138 persons per square kilometers in 2015. This showed a decrease of 29 persons (-0.47 percent) from 6,167 persons per square kilometer in 2010. In 2000, there were 5,520 persons residing in every square kilometers of land.
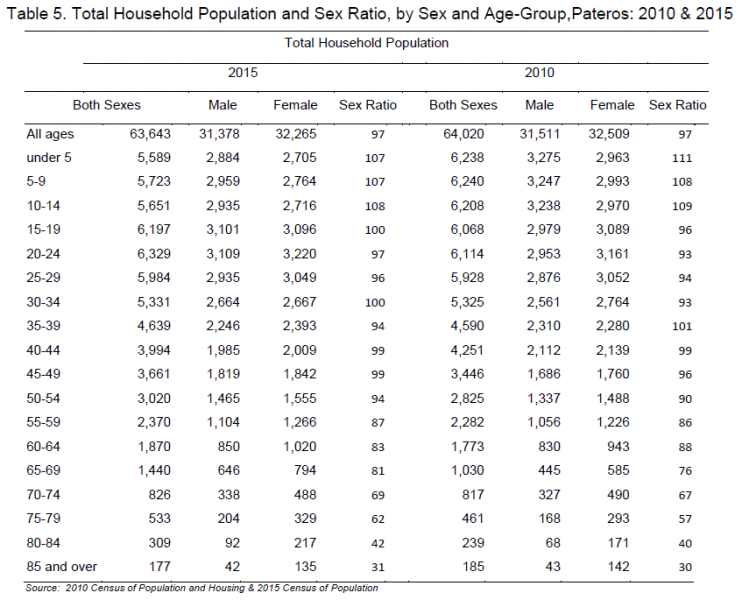
Sex ratio is 97 males for every 100 females
Of the total household population in the municipality of Pateros in 2015, 49.30 percent were males and 50.70 percent were females. These figures resulted to a sex ratio of 97 males for every 100 females, which is the same as that recorded in 2010 (97 males for every 100 females). The census result further revealed that the sex ratio for age group below 15 years had more males than females. Age groups 15-19 years and 30-34 years had equal numbers of males and females. However, age groups 20 to 29 years and 35 years and over had more females than males.
Refer to table 5 for details.
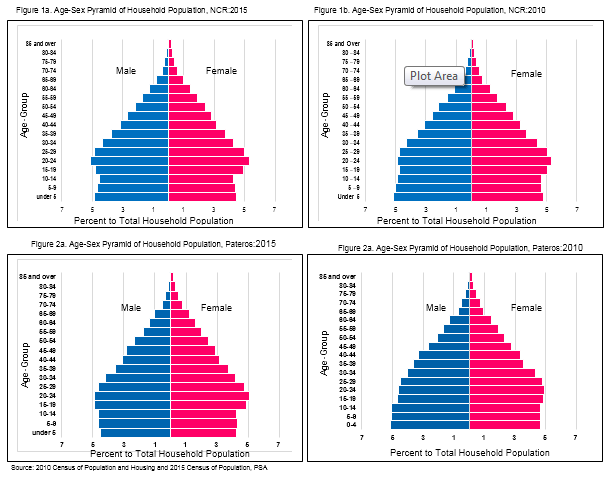
The following figures present the comparative age-sex pyramids of NCR and the municipality of Pateros for the years 2015 and 2010.
Children aged 5 to 9 years comprised the largest age group
The age-sex distribution of the household population showed that children aged 5 to 9 years comprised the largest age group, making up 8.99 percent of the household population, followed by those in the age groups 10 to 14 years (8.88 percent), and 0 to 4 years (8.78 percent).
Refer to Table 5 for details.

Median age increased to 26.95 years
The household population of the municipality of Pateros had a median of age 26.9 years, which means that half of the population was younger than 26.9 years. This is slightly higher than the median age of 26.0 years that was recorded in 2010.

There were more males than females among the never-married persons
Of the total population aged 10 years old and over, 47.63 percent were never-married while 35.56 percent were married. The rest of the population were categorized as follows: common-law/lived-in marital arrangement (10.27 percent), widowed (4.32 percent), and divorced/separated (2.18 percent).
The males (51.49 percent), outnumbered the female (48.51 percent) among the never-married persons while the rest of the categories for marital status had more females than males to wit: widowed (22.39 percent for males and 77.61 percent for females), divorced/separated (33.10 percent for males and 66.90 percent for females), and common-law/live-in (49.46 percent for males and 50.54 females).
Roman Catholics decreased to 90.7 percent
Among the total population in the municipality of Pateros in 2015, 90.67 percent reported the Roman Catholic as their religious affiliation. This proportion is slightly lower than the 92.30 percent reported in 2010. The next largest religious affiliation in the municipality was Iglesia ni Cristo with 2.82 percent, followed by the Evangelicals (Philippine Council of Evangelical Churches) with 1.33 percent.
School attendance rate was higher among males than among females
Of the 23,900 household population aged 5 to 24 years, 69.41 percent was attending school in School Year 2015-2016. The school attendance rate in 2015 was higher among males (51.40 percent) than among females (48.60 percent).
More females had attained higher levels of education
Of the total population aged five years and over, 18.88 percent had attended or completed elementary education, 37.63 percent had reached or finished high school, 17.30 percent were college undergraduates, and 18.23 percent were academic degree holders. The females (56.51 percent) outnumbered the males (43.49 percent) among those with academic degrees. On the other hand, there were more females (58.67 percent) than males (41.33 percent) among those with post baccalaureate courses.
Simple literacy rate was recorded at 99.8 percent
The municipality of Pateros posted a literacy rate of 99.77 percent among the 52,331 household population aged 10 years old and over. In the POPCEN 2015, a person is considered literate if he/she is able to read and write a simple message in any language or dialect. Literacy rate in 2015 in the municipality of Pateros was higher among females (51.21 percent) than among males (48.79 percent).
Senior citizens constitute 8.10 percent of the household population
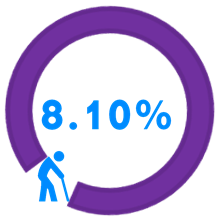
Senior citizens, comprising of those aged 60 years old and over, numbered 5,155 in the municipality of Pateros. Males accounted for 42.13 percent and the rest were females. Senior citizens represent 8.10 percent of the total household population.
Dependency ratio decreased to 47 dependents per 100 persons in the working age group
Dependency ratio remained at 47 dependents per 100 persons in the working age group. In 2015, the young dependents (0 to 14 years) comprised 26.65 percent of the total household population while the old dependents (65 years and over) posted a share of 5.16 percent. The working-age population (15 to 64 years) accounted for the remaining 68.19 percent.

The overall dependency ratio was 47, which indicates that for every 100 working-age population, there were about 47 dependents (39 young dependents and 8 old dependents). This ratio is lower than reported dependency ratio in 2010, which was recorded at 50 dependents per 100 working-age population.
About two in five of the household population are of school age
The school–age population (5 to 24 years) in the municipality of Pateros represents 37.55 percent of the total household population. This is slightly lower than the proportion of school-age population (38.47 percent) in 2010. Of the 23,900 household population who were of school age, males made up 50.64 percent while females made up 49.36 percent.
More than half of the total household population were of voting age
The municipality’s voting-age population (18 years and over) comprised 67.53 percent of the total population in 2015, an increase of 2.38 percent from 65.15 percent in 2010. There were more females (51.83 percent) than males (48.17 percent) among the voting-age population.
Male overseas workers outnumbered their female counterpart
In the municipality of Pateros, 2.96 percent (or 1,382 persons) of the 46,680 household population aged 15 years old and over were overseas workers. Male overseas workers outnumbered their female counterpart. They comprised 58.10 percent of the overseas workers from this municipality. The age group 45 years and over had the largest percentage (28.80 percent) of the total overseas workers from this municipality in 2015, followed by the age group 35 to 39 years (18.31 percent), 30 to 34 years (17.22 percent), 40 to 44 years (15.70 percent) and 25-29 years (14.33 percent). Furthermore, younger age overseas workers (24 and below) had a share of 5.64 percent.
Almost three in every five persons were engaged in gainful activity
Of the total 46,680 household population aged 15 years and over in municipality of Pateros in 2015, approximately three in every five persons (58.71 percent) were engaged in a gainful activity during the 12 months preceding the census.
By major occupation group, service and sales workers comprised the largest group (19.62 percent of all person with gainful activity). Clerical support workers came in next (16.36 percent), followed by workers engaged in elementary occupation (12.94 percent), plant and machine operator/assemblers (11.37 percent) and workers engaged in craft and related trades workers (10.10 percent).
Average household size in 2015 was 4.5 persons
The household population of the municipality in 2015 was 63,643 persons, lower by 377 persons from the household population of 64,020 persons in 2010. This translates a decreased by 0.59 percent from 64,020 in 2010 to 63,643 in 2015. The average household size in 2015 was 4.5 persons, higher than the average household size of 4.4 persons in 2010.
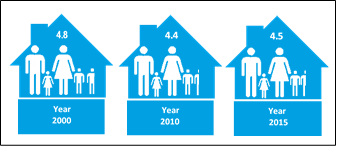
The table below presents the number of households and average household sizes by census year in the municipality of Pateros.

TECHNICAL NOTES
The Philippine Statistics Authority conducted the 2015 Census of Population (POPCEN) in August to September 2015 pursuant to Republic Act 10625, also known as the Philippine Statistical Act of 2013 and Executive order No. 352 – Designation of Statistical Activities that will Generate Critical Data for Decision-Making of the government and Private Sector, stipulates the conduct of a mid-decade census primarily to update the population count in all barangays nationwide. It was the 14th census of population that was undertaken since the first census in 1903.
The POPCEN 2015 was designed to take an inventory of the entire population of the country and collects information about their characteristics. The census of population is the source of information on the size and distribution, and composition of the population for different geographic units, that is, at the national down to barangay level. These information are vital in making rational plans and programs towards national and local development.
Census day for the POPCEN 2015 was August 1, 2015 as of 12:01 a.m. The Philippine Standard Geographic Codes (PSGC) was used for the disaggregation of geographic levels for the POPCEN 2015.
POPCEN 2015 made use of the de jure concept of enumeration wherein households and persons are enumerated in the area where they usually reside as of the census reference date. Enumeration lasted for about 25 days, from August 10 to September 6, 2016. Enumeration was extended until September 15, 2015 for the large provinces and some highly urbanized cities.
Proclamation No. 1269, signed by President Benigno Simeon C. Aquino III on 13 May 2016 made official the census counts for all purposes. Population counts also include Filipinos in Philippine Embassies, Consulates and Missions abroad. The population counts were based on census questionnaires accomplished by about 90,000 enumerators deployed during the nationwide census taking. These questionnaires were processed at the different Regional Census Processing Centers using the Optical Mark Recognition (OMR) technology along with the Census Integrated Processing System developed by PSA for this purpose. The successful completion of census-taking was made possible with the support of the local and national officials, government agencies, local government units, media, private agencies, and non-government organizations.
Concepts and Definitions
Age is the interval of time between a person’s date of birth and the census reference date (August 1, 2015). Expressed in completed years (as of last birthday), it is recorded in whole number.
Barangay is the smallest political unit in the country.
Household is a social unit consisting of a person living alone or a group of persons who sleep in the same housing unit and have a common arrangement in the preparation and consumption of food.
Household population refers to all persons who are members of the household.
Institutional population is the population enumerated in collective or institutional living quarters such as: dormitories or lodging houses, jails or prisons, military camps, convents or seminaries, and mental hospitals.
Marital status is the personal status of each individual with reference to marriage laws or customs of the country.
Median age is the age at which exactly half of the population is younger than this age and the other half is older than it.
Overall dependency ratio is the ratio of persons in the dependent ages (under 15 years old and over 64 years old) to persons in the economically active or working ages (15 to 64 years old) in the population.
Overseas worker is household member aged 15 years old and over who is out of the country due to an overseas employment.
Population growth rate is the rate which the population is increasing (or decreasing) in a given period due to natural increase and net migration, expressed as a percentage of the base population.
Religious affiliation is a particular system of beliefs, attitudes, emotions, and behavior constituting man’s relationship with the powers and principalities of the universe.
Sex ratio refers to the ratio of males to females in a given population, expressed as the number of males per 100 females.
Simple literacy rate is the proportion of person aged 10 years and over who are able to read and write a simple message in any language or dialect.
School attendance rate refers to the proportion of persons 5 to 24 years old who were attending school during the School Year June 2015 to March 2016 to school-age population (5 to 24 years old).
Total population is the sum of household population and institutional population. It also includes Filipinos in Philippine embassies, consulates, and mission abroad.
Usual activity or occupation is the kind of job or business, which a person aged 15 years old and over was engaged in most of the time during the 12 months preceding the time of census.

