The Consumer Price Index (CPI) is an indicator of the change in the average retail prices of a fixed basket of goods and services commonly purchased by households relative to a base year. It shows how much, on the average, prices of goods and services have increased or decreased from a particular reference period known as the base year. Since price is the cost or the amount of money for which something can be bought or sold, CPI therefore compares the current cost of certain goods and services with their cost at an earlier time.
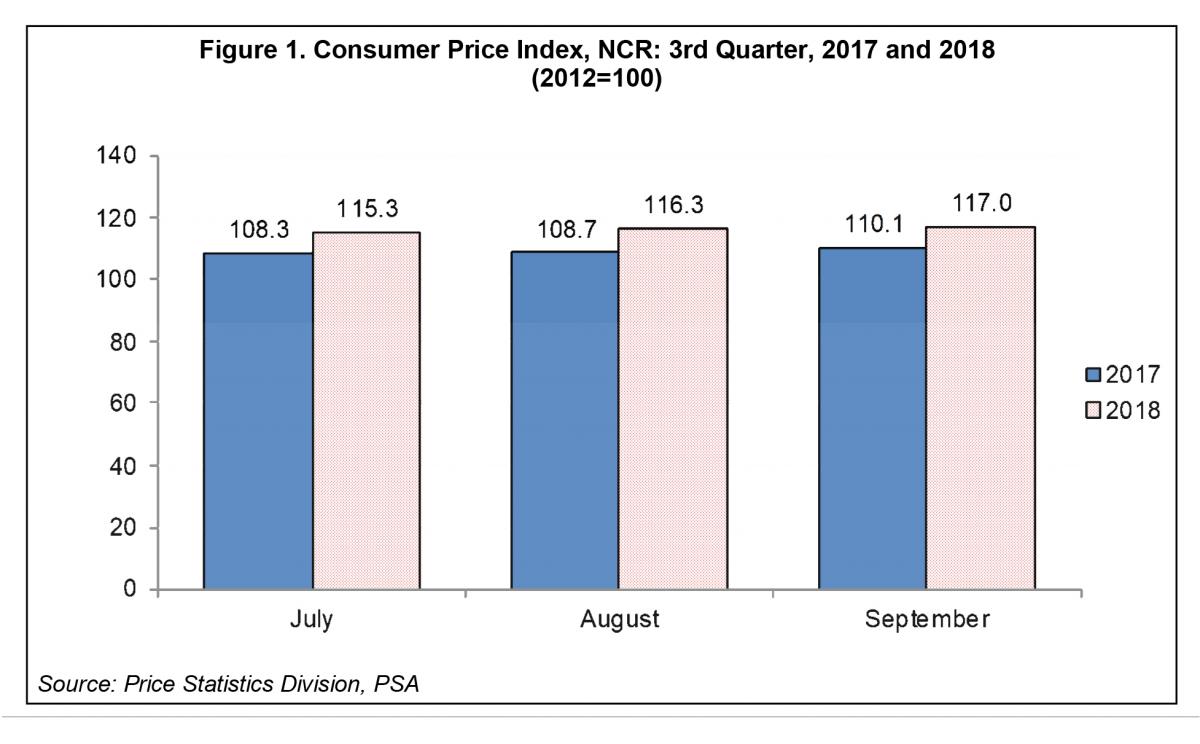
To illustrate, an index of 117.0 in NCR in September 2018 means that consumer prices, on the average, have increased by 17.0 percent from 2012. It also means that a basket of commodities which can be purchased at Php100.00 by an average Filipino household in NCR in 2012 can be bought at Php117.0 in September 2018.

CPIs in NCR accelerates in the third quarter of 2018
The CPI in NCR registered at 115.3 in July 2018 and accelerated to 117.0 in August 2018. By the end of the third quarter of 2018, CPI further accelerated by 0.7 point. Higher trend in CPI was recorded for all months during the third quarter of 2018 compared to the same period of the previous year. Refer to Table 1 for details.
Table 1. CPI for All Income Household by Commodity Group, NCR: 3rd Quarter, 2017 and 2018

NCR records lower CPI than the national figures in the third quarter of 2018
The NCR CPIs were consistently lower than the national CPI for all months of the third quarter of 2018. The Philippines and NCR figures showed linear trend.

NCR records highest inflation rate in August 2018
Inflation Rate (IR) in NCR increased from 6.5 percent in July 2018 and reached 7.0 percent in August 2018 but slightly decreased by 0.7 point in September 2018. IRs for Philippines and NCR exhibited similar trend.

NCR Inflation Rate is higher than the national figure for the third quarter 2018
NCR registered higher IR for the third quarter of 2018 compared to the national figures. The monthly IRs of NCR in the third quarter of 2018 were higher than those of the same period of 2017. Refer to Table 2 for details.
Table 2. Inflation Rate for All Income Households by Commodity Group, Philippines and NCR: July to September 2017 and 2018

PPP in NCR declines during the third quarter of 2018
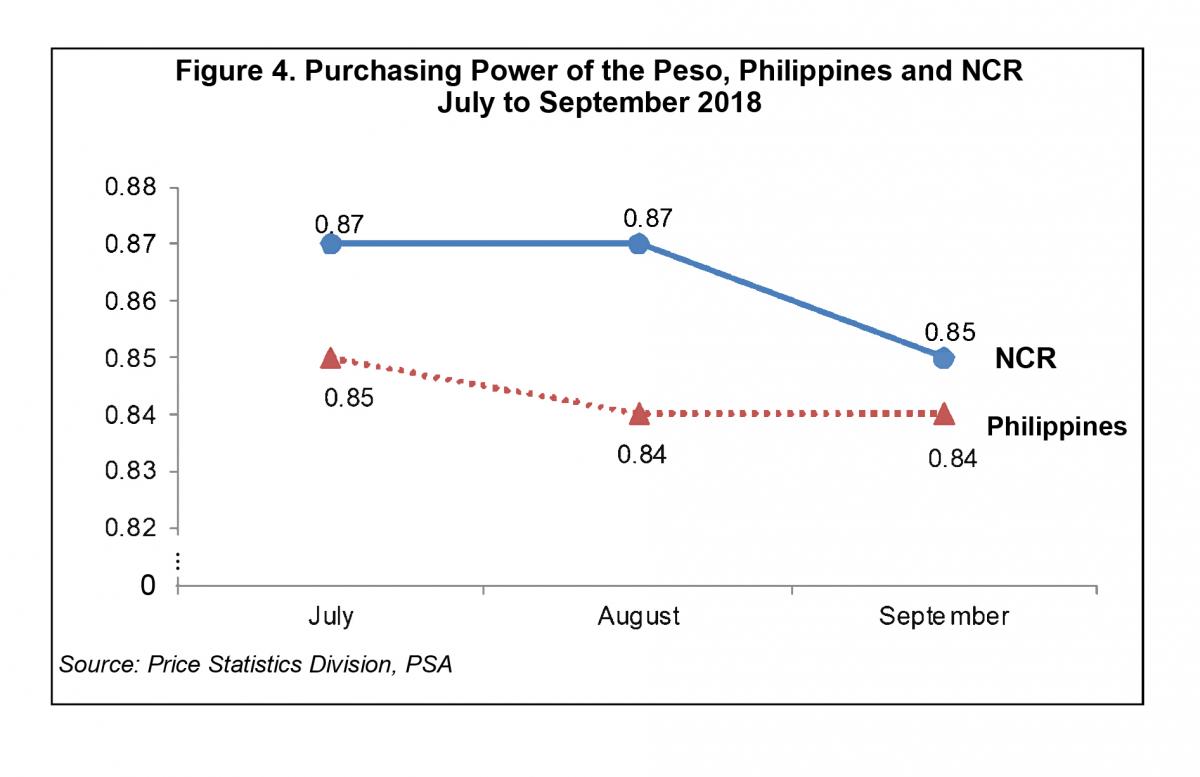
The Purchasing Power of Peso (PPP) for NCR declined from July to September 2018 as compared to the same months in 2017. The same trend was likewise observed for the national PPP.

Comparatively, the PPPs of NCR were higher than the national PPP in the third quarter of 2018.

PACIANO B. DIZON
(Chief Statistical Specialist)
Officer in Charge, NCR
