Release Date :
Reference Number :
2022-SR-13-012
Consumer Price Index in NCR slightly increases by one percentage point from its previous month's level
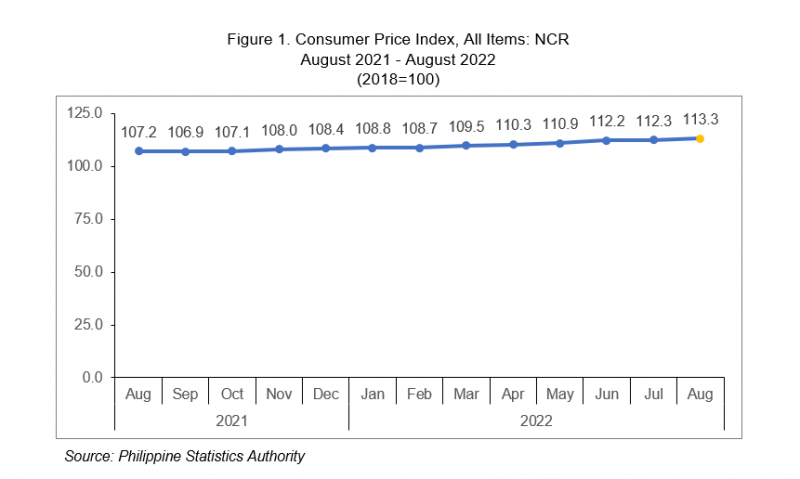
The Consumer Price Index inched up by one percentage point to reach 113.3 in August 2022 from 112.3 in July 2022. On yearly basis, the CPI grew by 6.1 percentage points during the month from 107.2 percent in August 2021. The CPI in NCR consistently remained below the Philippine’s record with 116.3 percent in August 2022. Across all regions, the CPI in NCR was still the second-lowest among the 17 regions with Central Visayas recording the lowest at 112.4 percent. On the other hand, Bicol Region had the highest CPI in August 2022 with 121.1 percent. The CPI in Bicol Region grew by 1.3 percentage points compared to its previous month’s record of 119.8 percent.
The CPI of 113.3 in August 2022 indicated that consumer prices, on average, had increased by 13.3 percent from the base year 2018. This can also be interpreted that a basket of commodities that can be purchased at PhP100.00 by an average Filipino household in NCR in 2018 can be bought at PhP113.3 in August 2022. (Figure 1)
Inflation rate in NCR move faster at 5.7 percent
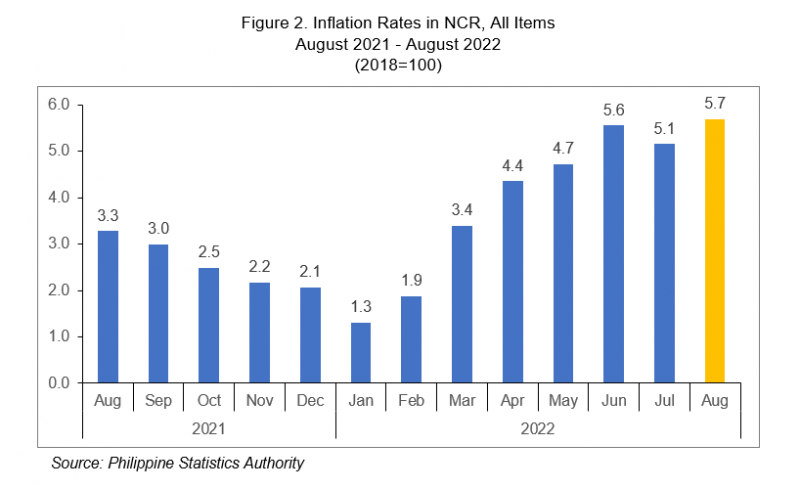
The inflation rate in NCR moved faster at 5.7 percent in August 2022 from 5.1 percent in the previous month. In August 2021, the Inflation rate was lower at 3.3 percent. The average inflation rate from January to August 2022 stood at 4.0 percent. (Figure 2)
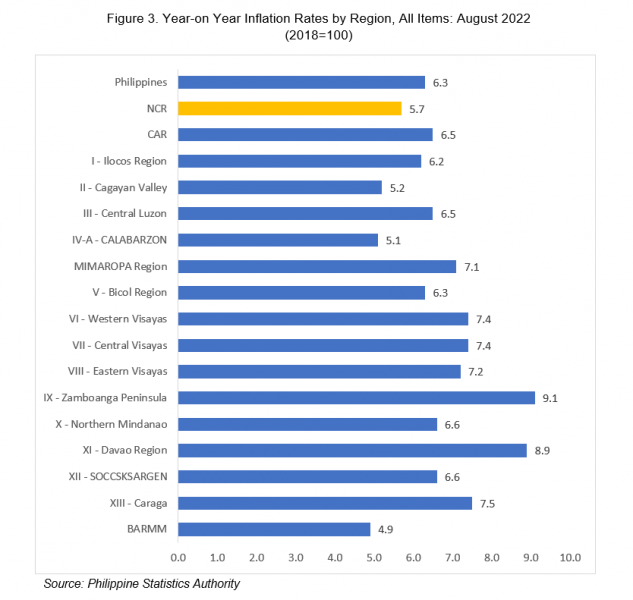
Across all regions, NCR was in fourth place among the regions with lower inflation rates in August 2022. The lowest inflation rate was recorded in Bangsamoro Autonomous Region in Muslim Mindanao (BARMM) with 4.9 percent while Region IX (Zamboanga Peninsula) registered the highest with 9.1 percent followed by Region X (Davao Region) with 8.9 percent and Region XIII (Caraga) with 7.5 percent. Meanwhile, the headline inflation rate in the Philippines eased down to 6.3 percent in August 2022 from 6.4 percent in the previous month. (Figure 3)
Index of restaurants and accommodation services is the major contributor to the faster inflation in NCR
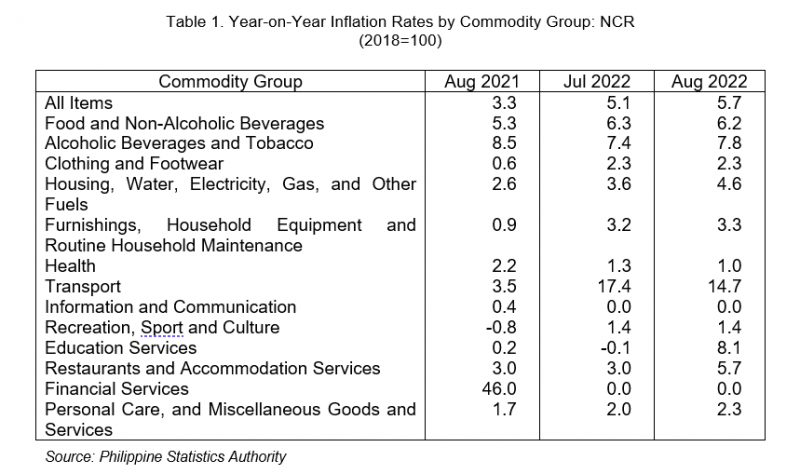
The acceleration of inflation in NCR in August 2022 was brought about by the higher annual increment in the restaurants and accommodation services index at 5.7 percent, from 3.0 percent in the previous month. Higher annual hikes were also observed in the indices of the following commodity groups during the month:
a. Alcoholic beverages and tobacco, 7.8 percent;
b. Housing, water, electricity, gas and other fuels, 4.6 percent
c. Furnishings, household equipment and routine household maintenance, 3.3 percent;
d. Education services, 8.1 percent; and
e. Personal care, and miscellaneous goods and services, 2.3 percent.
Meanwhile, lower annual increases were noted in the indices of food and non-alcoholic beverages at 6.2 percent; health at 1.0 percent; and transport at 14.7 percent. The indices of the rest of the commodity groups retained their respective previous month’s rates. (Table 1)
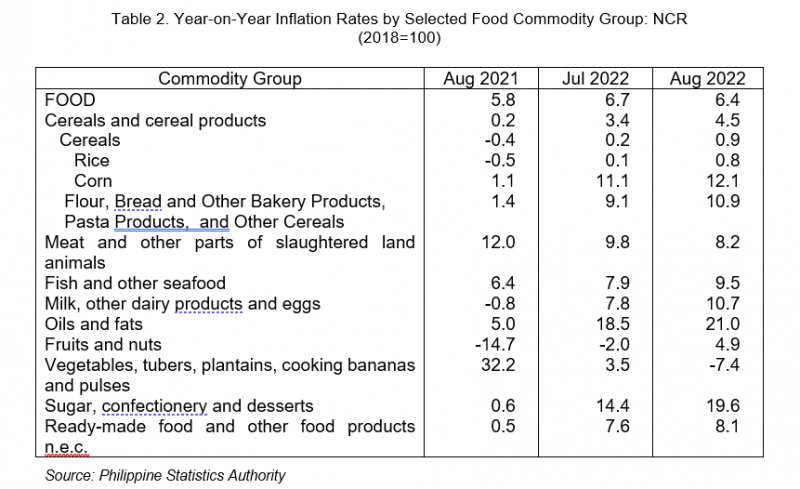
Inflation of food eases down to 6.4 percent
The inflation of the food index eased down to 6.4 percent in August 2022 from 6.7 percent in the previous month. In August 2021, the food index had 5.8 percent inflation.
The deceleration in the inflation of the food index was driven by the lower inflation of vegetables, tubers, plantains, cooking bananas and pulses which contracted to negative 7.4 percent in August from 3.5 percent in July 2022. In addition, the inflation of meat and other parts of slaughtered land animals commodity group also eased down to 8.2 percent in August from 9.8 percent in July 2022.
On the other hand, the inflation rate of fruits and nuts rebounded from -2.0 percent in July 2022 to 4.9 percent in August 2022. Similarly, the following food commodity groups exhibited higher annual increments in August 2022 as compared to the previous month:
a) Fish and other seafood, 9.5 percent;
b) Milk, other dairy products and eggs, 10.7 percent;
c) Oils and fats, 21.0 percent;
d) Sugar, confectionery and desserts, 19.6 percent; and
e) Ready-made food and other food products n.e.c., 8.1 percent
The cereals and cereal products index also exhibited faster inflation with an uptick in the inflation of rice from 0.1 percent in July 2022 to 0.8 percent in August 2022. The inflation of corn as well as the inflation of flour, bread and other bakery products, pasta products, and other cereals also moved at a faster rate with 12.1 percent and 10.9 percent, respectively. (Table 2).
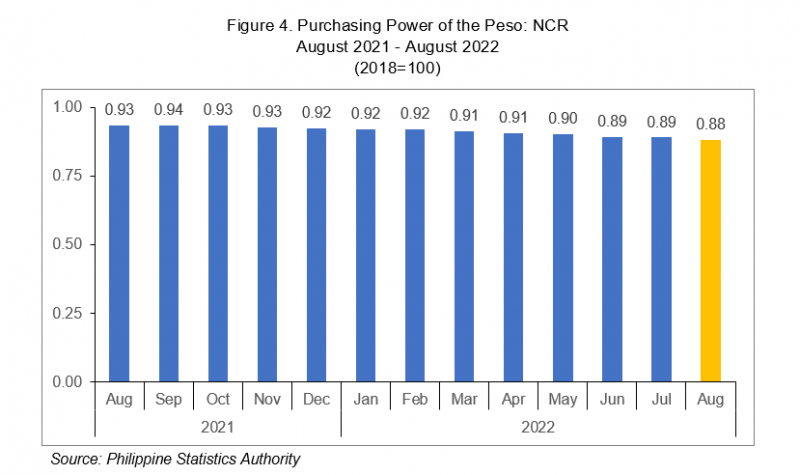
Purchasing Power of the Peso (PPP) falls to 0.88
The PPP is a measure of the real value of the peso in a given period relative to a chosen reference and is computed by getting the reciprocal of the CPI and multiplying the result by 100. The PPP is inversely related to the CPI thus an increase in the CPI will result in a decrease in the PPP. In August 2022, the PPP in NCR slightly dropped to 0.88 from the previous month’s level of 0.89. The increase of CPI in August 2022 slightly affected the PPP in NCR. Meanwhile, the PPP in August 2021 was at 0.93. (Figure 4)
PACIANO B. DIZON
Regional Director
TECHNICAL NOTES
Consumer Price Index
The Consumer Price Index (CPI) is an indicator of the change in the average retail prices of a fixed basket of goods and services commonly purchased by households for their day-to-day consumption relative to a base year.
Components of the CPI
a. Base Period
This is a reference date or simply a convenient benchmark to which a continuous series of index numbers can be related. Since the CPI measures the average changes in the retail prices of a fixed basket of goods, it is necessary to compare the movement in previous years back to a reference date at which the index is taken as equal to 100. The present series of CPI uses 2018 as the base period or base year.
b. Market Basket
Market basket refers to a sample of goods and services commonly purchased by the households.
The commodities included in the 2018-based CPI market basket are the modal commodities which were considered as the most commonly purchased/availed of commodities by the households. The composition of the market basket was determined based on updating the 2012 basket using the results of the 2021 Survey of Key Informants (SKI). In NCR, a total of 760 commodities are included in the market basket.
c. Weighting System
The weights for the 2018-based CPI were derived from the expenditure data of the 2018 Family Income and Expenditure Survey (FIES). The weight for each commodity/group of commodities is the proportion of the expenditure of the expenditure of commodity/group of commodities to the total national expenditure. The sum of the weights of the commodity groups at the national level is equal to 100.
Inflation Rate
The inflation rate is the annual rate of change or the year-on-year change in the Consumer Price Index.
Purchasing Power of the Peso
The Purchasing Power of the Peso (PPP) is a measure of the real value of the peso in a given period relative to a chosen reference period. It is computed by getting the reciprocal of the CPI and multiplying the result by 100.
| Attachment | Size |
|---|---|
|
|
266.83 KB |