Release Date :
Reference Number :
2022-SR-13-009
Consumer Price Index in NCR increases further by 1.3 percentage points from its previous month's level
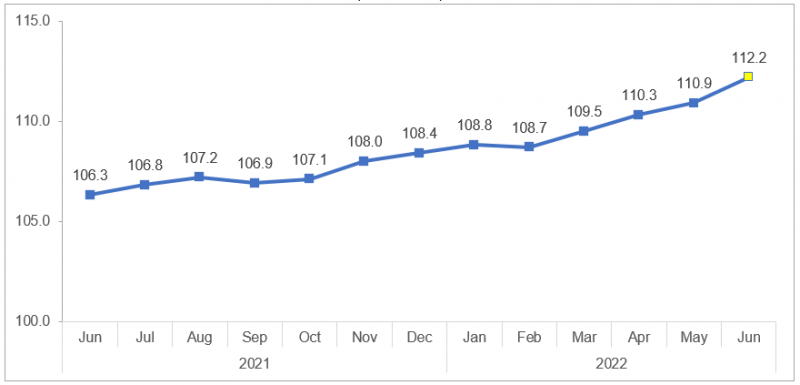
The Consumer Price Index this June 2022 in NCR stands at 112.2 which has increased by 1.3 percentage point from the previous month's record of 110.9 percent. On yearly basis, the CPI grew by 5.9 percentage points in June 2022 from 106.3 in June 2021. The CPI in NCR consistently remained below the Philippine’s record of 114.9. Across all regions, the CPI in NCR was still the second-lowest among the 17 regions with Central Visayas garnering the least at 110.9 percent. On the other hand, Bicol Region registered the highest CPI with 118.7.
The CPI of 112.2 in June 2022 indicated that consumer prices, on average, have increased by 12.2 percent from the base year 2018. lt can also be interpreted that a basket of commodities that can be purchased at PhP100.00 by an average Filipino household in NCR in 2018 can be bought at PhP112.2 in June 2022. (Figure 1)
Figure 1. Consumer Price Index, All Items: NCR
June 2021 - June 2022
(2018=100)
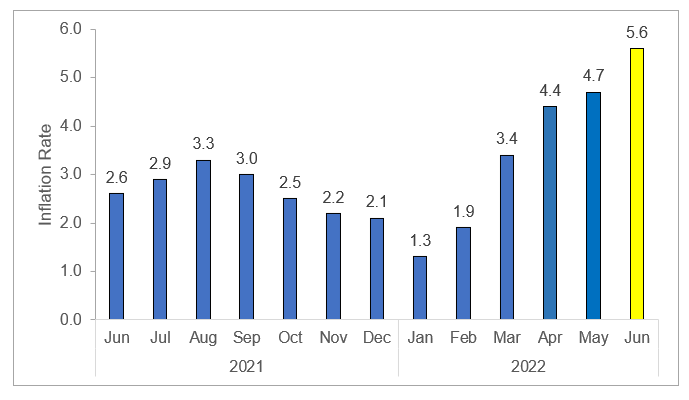
Inflation rate in NCR accelerated to 5.6 percent
The Inflation rate in NCR rose further to 5.6 percent in June 2022 as compared to 4.7 percent in the previous month. In June 2021, the Inflation rate was lower at 2.6 percent. The average Inflation rate from January to June 2022 stood at 3.1 percent. (Figure 2)
Figure 2. Inflation Rates in NCR, All Items
June 2021 - June 2022
(2018=100)
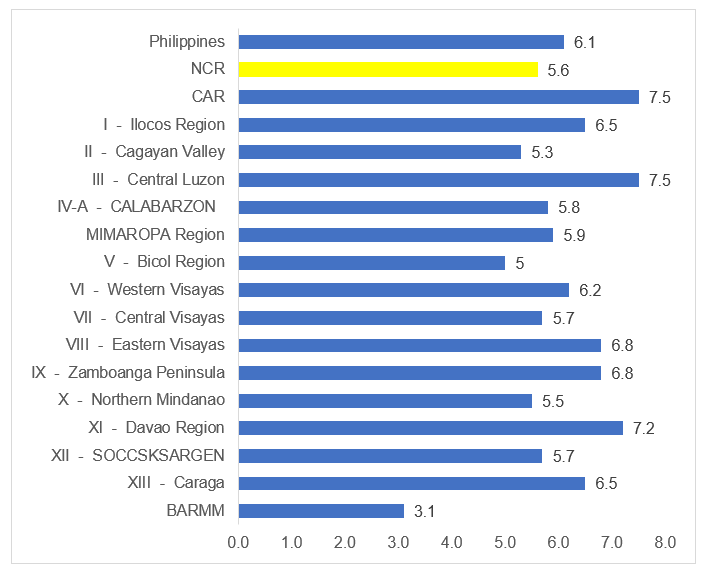
Across all regions, NCR recorded a 5.6 percent inflation rate in June 2022 making the region in 5th place with a lower inflation rate. The lowest inflation rate was observed in Bangsamoro Autonomous Region in Muslim Mindanao (BARMM) with 3.1 percent while Region III (Central Luzon) and the Cordillera Administrative Region (CAR) registered the highest with 7.5 percent. Headline inflation in the Philippines was observed at 6.1 percent. (Figure 3)
Figure 3. Year-on Year Inflation Rates by Region, All Items
June 2022
(2018=100)
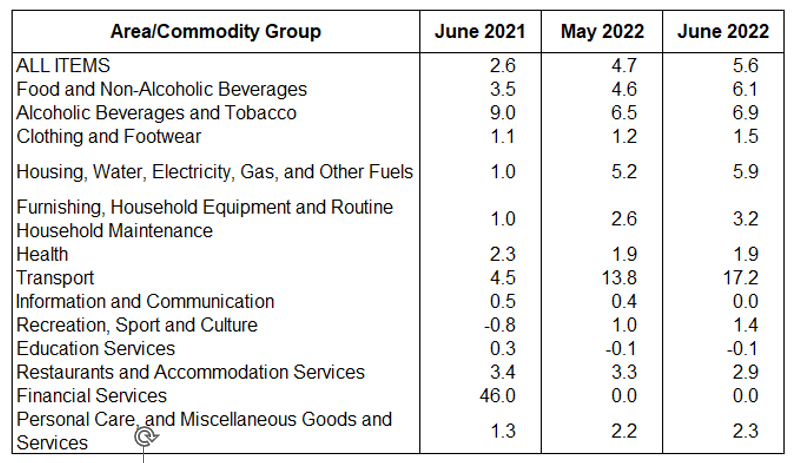
Food and non-alcoholic beverages are still the largest contributors to the faster inflation in NCR
The increase in the region’s inflation was largely brought about by the higher inflation of food and non-alcoholic beverages at 6.1 percent. The rose in inflation rate was also influenced by a higher increase in Transport with 17.2 percent and Housing, Water, Electricity, Gas, and other Fuels at 5.9 percent.
In addition, what contributed to the uptrend in the overall inflation during the period were faster annual increments in the indices of the following commodity groups as compared with their previous month’s inflation rates:
a. Furnishings, Household Equipment and Routine Household Maintenance, 3.2 percent;
b. Clothing and Footwear, 1.5 percent
c. Alcoholic beverages and tobacco, 6.9 percent
d. Personal Care, and Miscellaneous Goods and Services, 2.3 percent
e. Recreation, Sport and Culture, 1.4 percent
The rest of the commodity groups either retained their previous month's inflation or had zero percent annual growth. (Table 1)
Table 1. Year-on Year Inflation Rates by Commodity Group: NCR
(2018=100)
Source: Philippine Statistics Authority
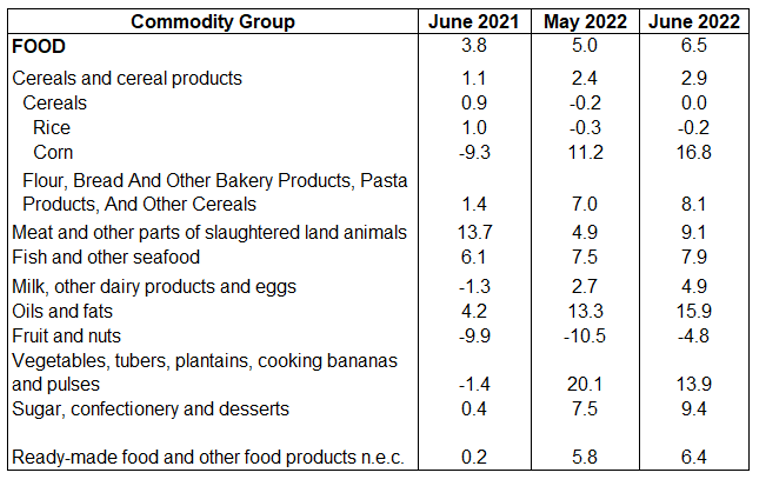
Annual growth rate in the food index rose further to 6.5 percent in June 2022, from 5.0 percent in the previous month. In June 2021, the food index had 3.8 percent inflation.
The inflation rate of Meat and other parts of slaughtered land animals accelerated further to 9.1 percent in June 2022 from 4.9 percent in the previous month. In addition, the fish and other seafood commodity group also increased to 7.9 percent, and vegetables, tubers, plantains, cooking bananas and pulses commodity group decreased to 13.9 percent in June 2022 from 20.1 from the previous month.
The following food commodity groups also exhibited higher annual increments in June 2022:
a) Flour, bread and other bakery products, pasta products, and other cereals, 8.1 percent
b) Milk, other dairy products, and eggs, 6.8 percent
c) Ready-made food and other food products n.e.c., 4.9 percent
d) Oils and Fats, 4.8 percent
e).Sugar, confectionery, and desserts, 4.5 percent
On the other hand, the inflation in the corn index increased to 16.8 percent in June 2022. Similarly, the rice index increased but still negative at -0.2 percent from a -0.3 percent inflation last month. Meanwhile, the fruits and nuts index increased but is still negative at -4.8 percent inflation from -10.5 percent during May 2022. (Table 2)
Table 2. Year-on Year Inflation Rates by selected Food Commodity Group: NCR
(2018=100)
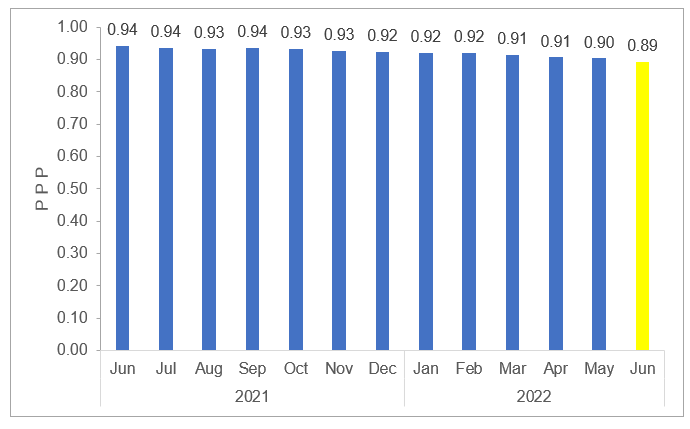
Purchasing Power of the Peso (PPP) skids to 0.89
The PPP is a measure of the real value of the peso in a given period relative to a chosen reference and is computed by getting the reciprocal of the CPI and multiplying the result by 100. The PPP is inversely related to the CPI thus an increase in the CPI will result in a decrease in the PPP.
In June 2022, the PPP in NCR slightly dropped to 0.89 from the previous month’s level of 0.90. The increase in CPI between the period April and June 2022 slightly affected the PPP in NCR. Meanwhile, the PPP in June 2021 was at 0.94. (Figure 4)
Figure 4. Purchasing Power of the Peso: NCR
April 2021 - April 2022
(2018=100)
(SGD.)
PACIANO B. DIZON
Regional DIrector
TECHNICAL NOTES
Consumer Price Index
The Consumer Price Index (CPI) is an indicator of the change in the average retail prices of a fixed basket of goods and services commonly purchased by households for their day-to-day consumption relative to a base year.
Components of the CPI
Base Period
This is a reference date or simply a convenient benchmark to which a continuous series of index numbers can be related. Since the CPI measures the average changes in the retail prices of a fixed basket of goods, it is necessary to compare the movement in previous years back to a reference date at which the index is taken as equal to 100. The present series of CPI uses 2018 as the base period or base year.
Market Basket
Market basket refers to a sample of goods and services commonly purchased by the households.
The commodities included in the 2018-based CPI market basket are the modal
commodities which were considered as the most commonly purchased/availed of commodities by the households. The composition of the market basket was determined based on updating the 2012 basket using the results of the 2021 Survey of Key Informants (SKI). In NCR, a total of 760 commodities are included in the market basket.
Weighting System
The weights for the 2018-based CPI were derived from the expenditure data of the 2018 Family Income and Expenditure Survey (FIES). The weight for each commodity/group of commodities is the proportion of the expenditure of the expenditure of commodity/group of commodities to the total national expenditure. The sum of the weights of the commodity groups at the national level is equal to 100.
Inflation Rate
The inflation rate is the annual rate of change or the year-on-year change in the Consumer Price Index.
Purchasing Power of the Peso
The Purchasing Power of the Peso (PPP) is a measure of the real value of the peso in a given period relative to a chosen reference period. It is computed by getting the reciprocal of the CPI and multiplying the result by 100.
| Attachment | Size |
|---|---|
|
|
2.05 MB |