Release Date :
Reference Number :
2022-SR-13-013
Consumer Price Index in NCR increases to 113.9 percent
The Consumer Price Index increased to 113.9 percent in September 2022 from 113.3 percent in August 2022. On yearly basis, the CPI grew by 7.0 percentage points during the month from 109.6 percent in August 2021. The CPI in NCR consistently remained below the Philippine’s record with 116.8 percent in September 2022. Across all regions, the CPI in NCR remained the second-lowest among the 17 regions with Central Visayas registering the lowest at 113.3 percent. On the other hand, Bicol Region had the highest CPI in September 2022 with 121.4 percent. Meanwhile, the Bangsamoro Autonomous Region in Muslim Mindanao (BARMM) registered the highest increase of 1.2 percentage points in CPI or from 109.9 percent in August 2022 to 116.5 percent in September 2022.
The CPI of 113.9 in September 2022 indicated that consumer prices, on average, had increased by 13.9 percent from the base year 2018. This can also be interpreted that a basket of commodities that can be purchased at PhP100.00 by an average Filipino household in NCR in 2018 can be bought at PhP113.9 in September 2022. (Fig. 1)

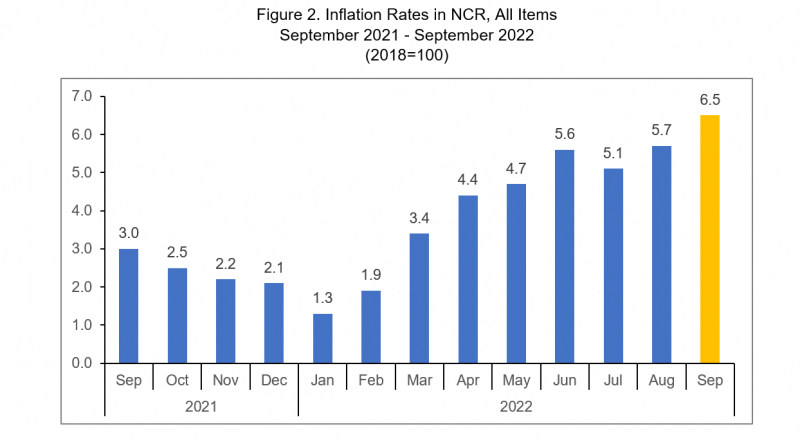
Inflation rate in NCR accelerates to 6.5 percent
The inflation rate in NCR accelerated to 6.5 percent in September 2022 from 5.7 percent in the previous month. In September 2021, the Inflation rate was lower at 3.0 percent. The average inflation rate from January to September 2022 stood at 4.3 percent. (Fig. 2)
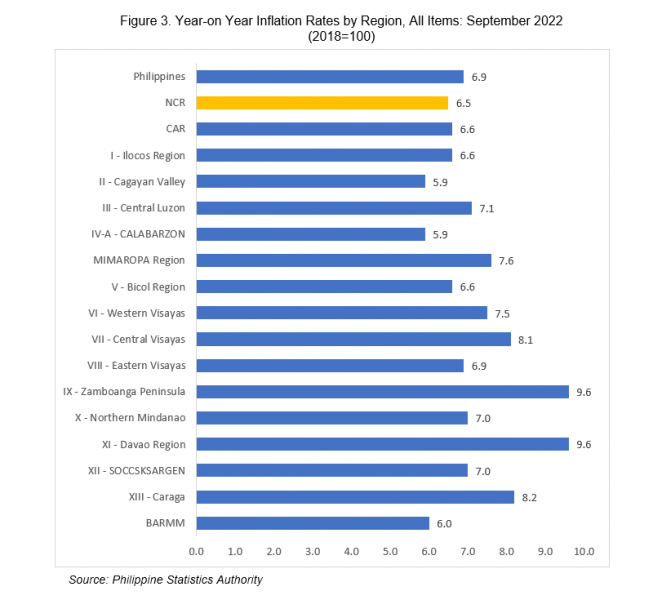
Across all regions, NCR was in third place among the regions with lower inflation rates in September 2022. The lowest inflation rate was recorded in Region IV-A (CALABARZON) with 5.9 percent followed by BARMM with 6.0 percent. On the other hand, Region IX (Zamboanga Peninsula) and Region X (Davao Region) registered the highest with both 9.6 percent followed by Region XIII (Caraga) with 8.2 percent. At the national level, the headline inflation rate for the Philippines stood at 6.9 percent during the month up by 0.6 percentage points from 6.3 percent in August 2022. (Fig. 3)
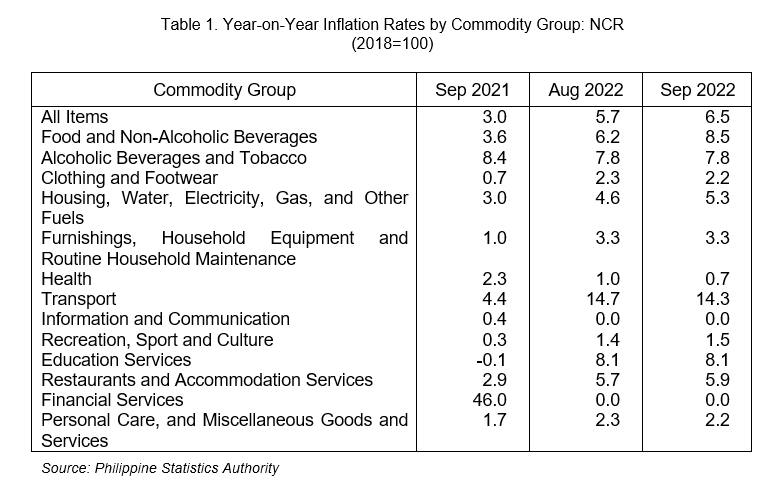
Index of food and non-alcoholic beverages is the main contributor to the faster inflation in NCR
The acceleration of inflation in NCR was brought about by the higher annual hike in the food and non-alcoholic beverages index at 8.5 percent, from 6.2 percent in August 2022. Also contributing to the uptrend in the inflation in NCR were the higher annual increases in the indices of housing, water, electricity, gas and other fuels at 5.3 percent; recreation, sport, and culture at 1.5 percent; and restaurants and accommodation services at 5.9 percent.
On the other hand, lower annual increases were noted in the indices of the following commodity groups:
a. Clothing and footwear, 2.2 percent;
b. Health, 0.7 percent;
c. Transport, 14.3 percent; and
d. Personal care, and miscellaneous goods and services, 2.2 percent.
The indices of the rest of the commodity groups retained their respective August 2022 rates. (Table 1)
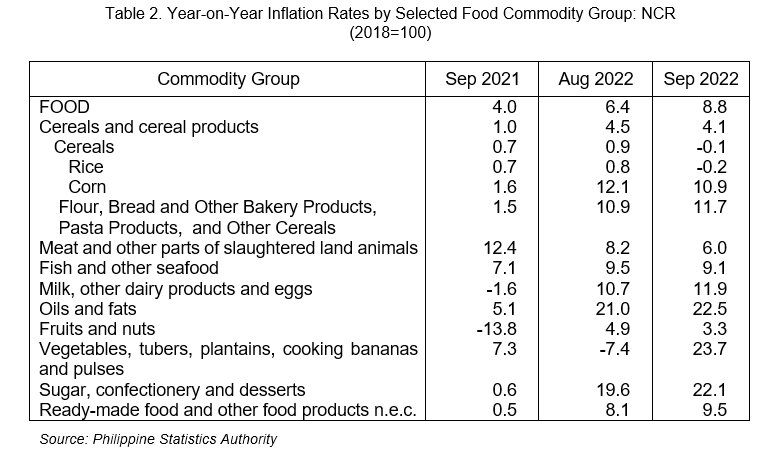
Inflation of food moves faster at 8.8 percent
The inflation of the food index moved faster at 8.8 percent in September 2022 from 6.4 percent in the previous month. In September 2021, the food index had 4.0 percent inflation.
The acceleration in food inflation was primarily influenced by the turned around in the index of vegetables, tubers, plantains, cooking bananas and pulses at 23.7 percent in September 2022 from -7.4 percent in August 2022. Similarly, the following food commodity groups also exhibited higher annual increments in September 2022 as compared to the previous month:
a) Flour, Bread and Other Bakery Products, Pasta Products, and Other Cereals, 11.7 percent;
b) Milk, other dairy products and eggs, 11.9 percent;
c) Oils and fats, 22.5 percent;
d) Sugar, confectionery and desserts, 22.1 percent; and
e) Ready-made food and other food products n.e.c., 9.5 percent
The index of cereals and cereal products exhibited a slowdown in inflation to 4.1 percent during the month from 4.5 percent in August 2022. The deceleration in the inflation was brought mainly by the contraction in inflation of Rice to -0.2 percent from 0.8 percent and slowed down in the inflation of corn to 10.9 percent from 12.1 percent. In contrast, the inflation of flour, bread and other bakery products, pasta products, and other cereals inched up to 11.7 percent in September 2022 from 10.9 percent in the previous month. (Table 2)
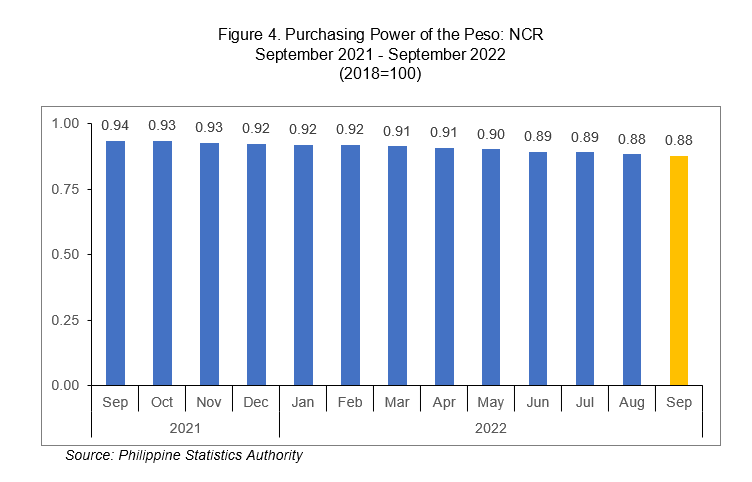
Purchasing Power of the Peso (PPP) remains at 0.88
The PPP is a measure of the real value of the peso in a given period relative to a chosen reference and is computed by getting the reciprocal of the CPI and multiplying the result by 100. The PPP is inversely related to the CPI thus an increase in the CPI will result in a decrease in the PPP.
In September 2022, the PPP in NCR retained its previous month’s level of 0.88. The increase of CPI in September 2022 did not significantly affect the PPP in NCR. Meanwhile, the PPP in September 2021 was higher at 0.94. (Figure 4)
SGD.
PACIANO B. DIZON
Regional Director
TECHNICAL NOTES
Consumer Price Index
The Consumer Price Index (CPI) is an indicator of the change in the average retail prices of a fixed basket of goods and services commonly purchased by households for their day-to-day consumption relative to a base year.
Components of the CPI
Base Period
This is a reference date or simply a convenient benchmark to which a continuous series of index numbers can be related. Since the CPI measures the average changes in the retail prices of a fixed basket of goods, it is necessary to compare the movement in previous years back to a reference date at which the index is taken as equal to 100. The present series of CPI uses 2018 as the base period or base year.
Market Basket
Market basket refers to a sample of goods and services commonly purchased by the households.
The commodities included in the 2018-based CPI market basket are the modal
commodities which were considered as the most commonly purchased/availed of commodities by the households. The composition of the market basket was determined based on updating the 2012 basket using the results of the 2021 Survey of Key Informants (SKI). In NCR, a total of 760 commodities are included in the market basket.
Weighting System
The weights for the 2018-based CPI were derived from the expenditure data of the 2018 Family Income and Expenditure Survey (FIES). The weight for each commodity/group of commodities is the proportion of the expenditure of the expenditure of commodity/group of commodities to the total national expenditure. The sum of the weights of the commodity groups at the national level is equal to 100.
Inflation Rate
The inflation rate is the annual rate of change or the year-on-year change in the Consumer Price Index.
Purchasing Power of the Peso
The Purchasing Power of the Peso (PPP) is a measure of the real value of the peso in a given period relative to a chosen reference period. It is computed by getting the reciprocal of the CPI and multiplying the result by 100.
| Attachment | Size |
|---|---|
|
|
126.34 KB |