Release Date :
Reference Number :
2023-SR-13-009
Consumer Price Index in NCR upticks to 118.1 percent
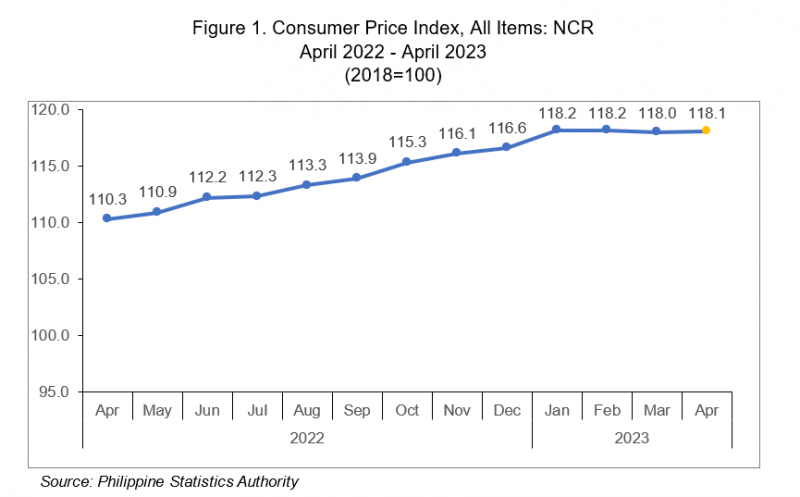
The CPI in NCR this April 2023 upticked to 118.1 percent from 118.0 percent in the previous month. On yearly basis, the CPI increased by 7.8 percentage points during the month from 110.3 percent in April 2022. The CPI in NCR consistently remained below the Philippines’ record settling at 120.9 percent, lower by 0.2 percentage point than its 121.1 percent index in March 2023.
The CPI of 118.1 percent in April 2023 indicated that consumer prices, on average, had increased by 18.0 percent from the base year 2018. This can also be interpreted that a basket of commodities that can be purchased at PhP100.00 by an average Filipino household in NCR in 2018 can be bought at PhP118.1 in April 2023. (Figure 1)
Inflation rate in NCR slides further to 7.1 percent
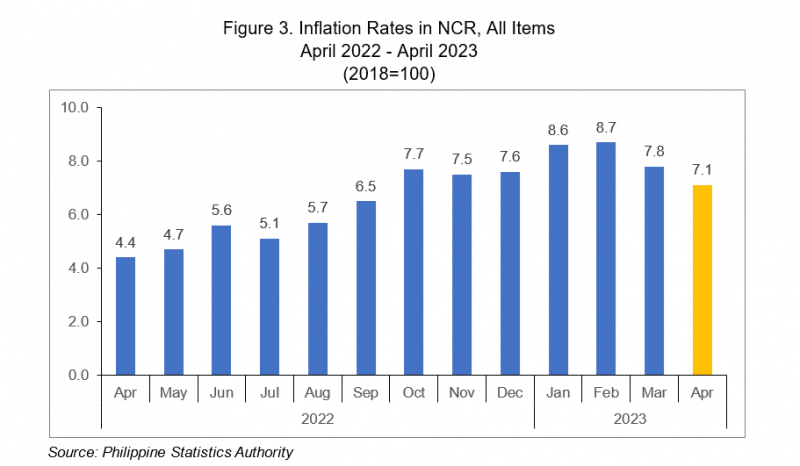
The inflation rate in NCR slid further to 7.1 percent in April 2023, down by 0.7 percentage point from 7.8 percent in March 2023. In April 2022, the inflation rate was lower at 4.4 percent. The average inflation for the first four (4) months of 2023 stood at 8.1 percent. (Figure 3)
At the national level, the headline inflation rate for the Philippines likewise slowed down to 6.6 percent in April 2023 from 7.6 percent in March 2023. Moreover, slower inflation was also observed in all other regions. Among the regions that registered slower inflation, Region IX (Zamboanga Peninsula) recorded the most with a 2.6 percentage points decline in their respective inflation rates this month compared to March 2023. This was followed by Region XI (Davao Region) and Region XII (SOCCSKSARGEN) both with a decline of 1.5 percentage points.
Index of housing, water, electricity, gas and other fuels draws slower inflation in NCR
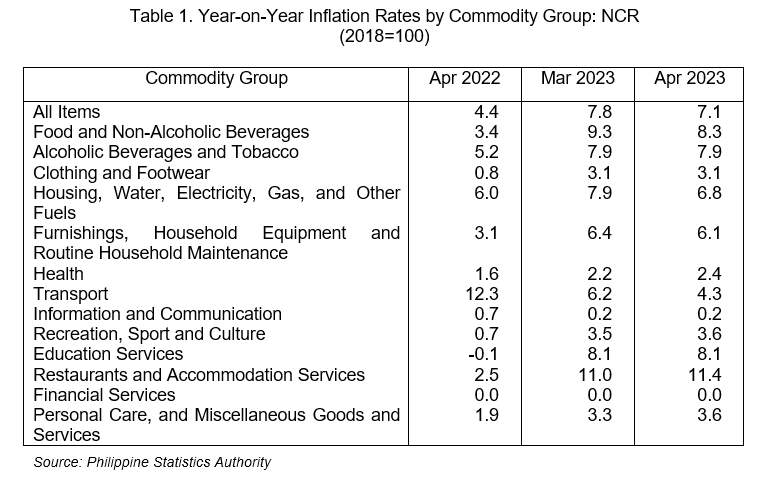
The index of housing, water, electricity, gas and other fuels drew slower inflation in NCR with 0.9 percentage points dropped from its 7.9 percent inflation rate in March 2023 to reach 6.8 percent this April 2023. This contributed to around 39.7 percent of the downtrend in inflation. The index of food and non-alcoholic beverages commodity group came next with an inflation rate of 8.3 percent, down by 1.0 percentage points from 9.3 percent in March 2023 and contributed around 38.8 percent to the slowdown in inflation. This was followed by the index of transport and index of furnishings, household equipment and routine household maintenance commodity group with an inflation rate of 4.3 percent and 6.1 percent, respectively.
In contrast, higher annual markups were also noted in the following commodity groups during the month:
- Health, 2.4 percent;
- Restaurants And Accommodation Services, 11.4 percent;
- Recreation, sport and culture, 3.6 percent; and
- Personal care, and miscellaneous goods and services, 3.6 percent.
Meanwhile, the indices for the rest of the commodity groups continued to move at their respective rates in April 2023. (Table 1)
Food inflation decelerates further to 8.5 percent
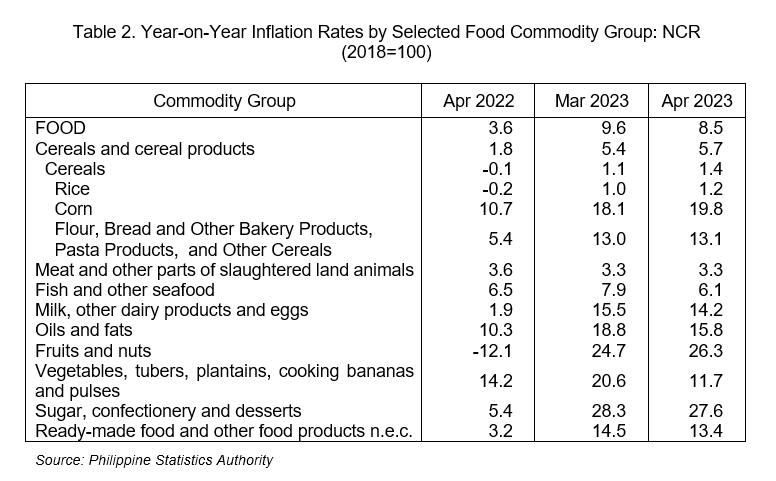
Inflation of food continued its downward trend as it decelerated further to 8.5 percent in April 2023 from 9.6 percent in March 2023. Similar to the previous month, the index of vegetables, tubers, plantains, cooking bananas and pulses remained as the main contributor to slower food inflation as its annual increment dipped further to 11.7 percent from 20.6 percent in March 2023. This was followed by the index of Oils and fats with an annual dip of 3.0 percentage points this month from 18.8 percent in March 2023 to 15.8 in April 2023 and the index of fish and other seafood with 6.1 percent from 7.9 percent in the previous month. Moreover, other food commodity groups that contributed to slower food inflation were the following:
a) Milk, other dairy products and eggs, 14.2 percent;
b) Sugar, confectionery and desserts, 27.6 percent.
c) Ready-made food and other food products n.e.c., 13.4 percent.
On the other hand, higher annual hikes were noted in the indices of the following food commodity groups during the month:
a) Rice, 1.2 percent;
b) Corn, 19.8 percent;
c) Flour, Bread And Other Bakery Products, Pasta Products, And Other Cereals, 13.1 percent; and
d) Fruits and Nuts, 26.3 percent. (Table 2)
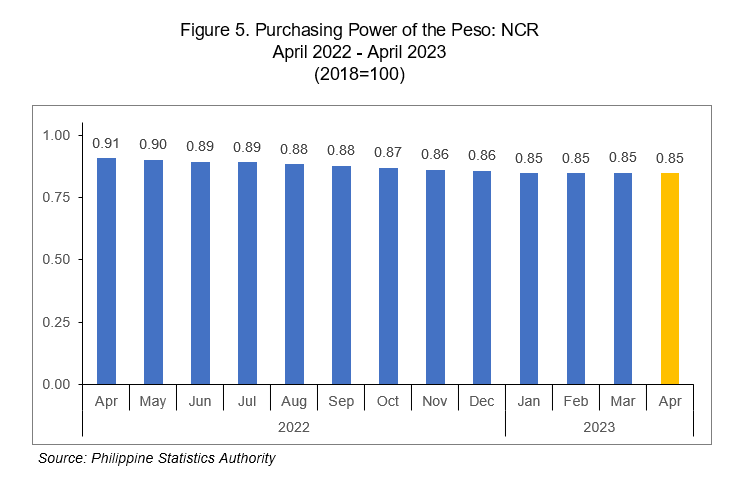
Purchasing Power of Peso (PPP) remains at 0.85
The PPP is a measure of the real value of the peso in a given period relative to a chosen reference and is computed by getting the reciprocal of the CPI and multiplying the result by 100. The PPP is inversely related to the CPI thus an increase in the CPI will result in a decrease in the PPP.
The PPP in NCR remained at 0.85 in April 2023. This was the fourth consecutive month that the PPP stood at 0.85. This means that a peso in 2018 was worth 85 centavos in April 2023. The PPP in April 2022 was higher at 0.91. (Figure 5)
SGD.
PACIANO B. DIZON
Regional Director
Technical Notes
Consumer Price Index
The Consumer Price Index (CPI) is an indicator of the change in the average retail prices of a fixed basket of goods and services commonly purchased by households for their day-to-day consumption relative to a base year.
Components of the CPI
a. Base Period
This is a reference date or simply a convenient benchmark to which a continuous series of index numbers can be related. Since the CPI measures the average changes in the retail prices of a fixed basket of goods, it is necessary to compare the movement in previous years back to a reference date at which the index is taken as equal to 100. The present series of CPI uses 2018 as the base period or base year.
b. Market Basket
Market basket refers to a sample of goods and services commonly purchased by the households.
The commodities included in the 2018-based CPI market basket are the modal
commodities which were considered as the most commonly purchased/availed of commodities by the households. The composition of the market basket was determined based on updating the 2012 basket using the results of the 2021 Survey of Key Informants (SKI). In NCR, a total of 760 commodities are included in the market basket.
c. Weighting System
The weights for the 2018-based CPI were derived from the expenditure data of the 2018 Family Income and Expenditure Survey (FIES). The weight for each commodity/group of commodities is the proportion of the expenditure of the expenditure of commodity/group of commodities to the total national expenditure. The sum of the weights of the commodity groups at the national level is equal to 100.
Inflation Rate
The inflation rate is the annual rate of change or the year-on-year change in the Consumer Price Index.
Purchasing Power of the Peso
The Purchasing Power of the Peso (PPP) is a measure of the real value of the peso in a given period relative to a chosen reference period. It is computed by getting the reciprocal of the CPI and multiplying the result by 100.
| Attachment | Size |
|---|---|
|
|
253.69 KB |