Release Date :
Reference Number :
2018-026
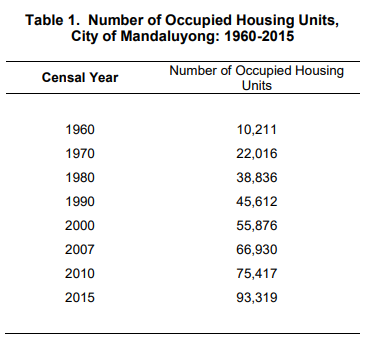
The number of occupied housing units in the City of Mandaluyong increased by 23.7 percent in 2015
The number of housing units in the City of Mandaluyong reached to 93,319, with 100,356 households occupying it, as of August 1, 2015. The number of occupied housing units increased by 23.7 percent than the previous censal year.
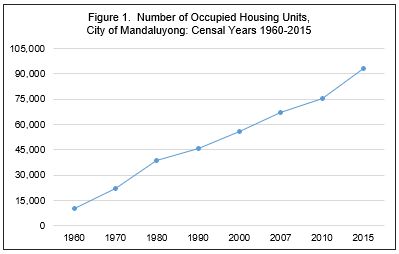
Occupied housing units in the city have been constantly increasing from 1960 to 2015. The year 2015 recorded the largest increase in the number of occupied housing units from 75,417 in 2010 to 93,319 in 2015.
The year 1970 marked the fastest growth rate with 115.6 percent while 2010 registered the slowest growth with 12.7 percent.
About 13.4 percent of the occupied housing units in the National Capital Region were in the City of Mandaluyong.
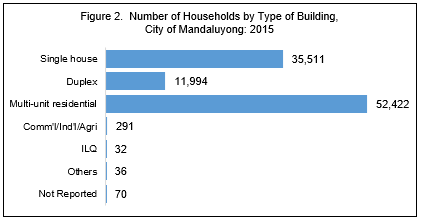
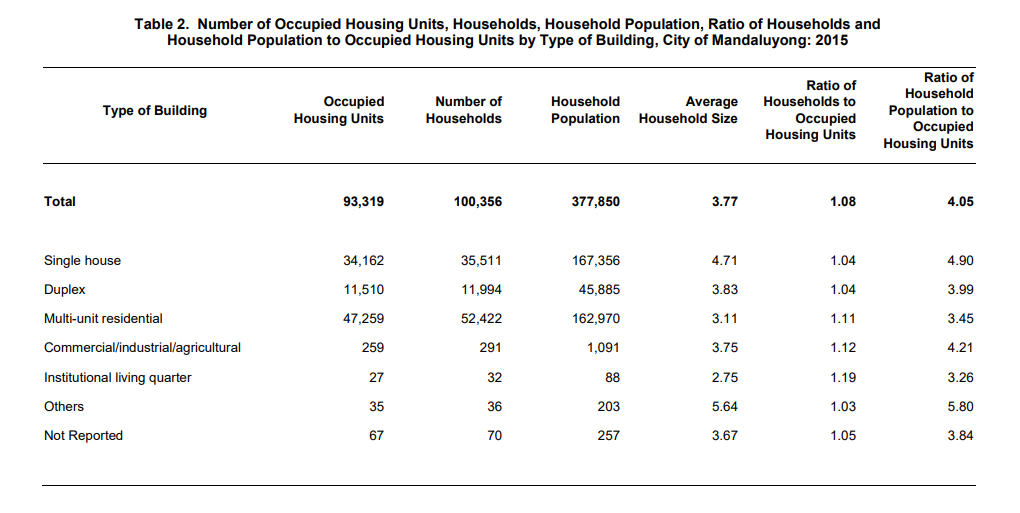
Majority of the households occupy multi-unit residential
There are six types of housing units: (a) single house; (b) duplex; (c) multi-unit residential; (d) commercial/industrial/agricultural; (e) institutional living quarter; and (f) others that refers to living quarters that are neither intended for human habitation nor located in permanent buildings but nevertheless used as living quarters at the time of census.
Among these types of housing units, 52.2 percent of the households occupied multi-unit residential while 35.4 and 12.0 percent on single houses and duplex, respectively. On the other hand, commercial/industrial/agricultural and institutional living quarters (ILQ) accounted for 0.3 percent. The rest were other types of housing units and not reported.
There are 108 households per 100 occupied housing units
The 2015 Census of Population revealed that there were 100,356 households in the city. On the average, there are four persons per household.
The households-to-occupied housing units resulted to a ratio of 108 is to 100.
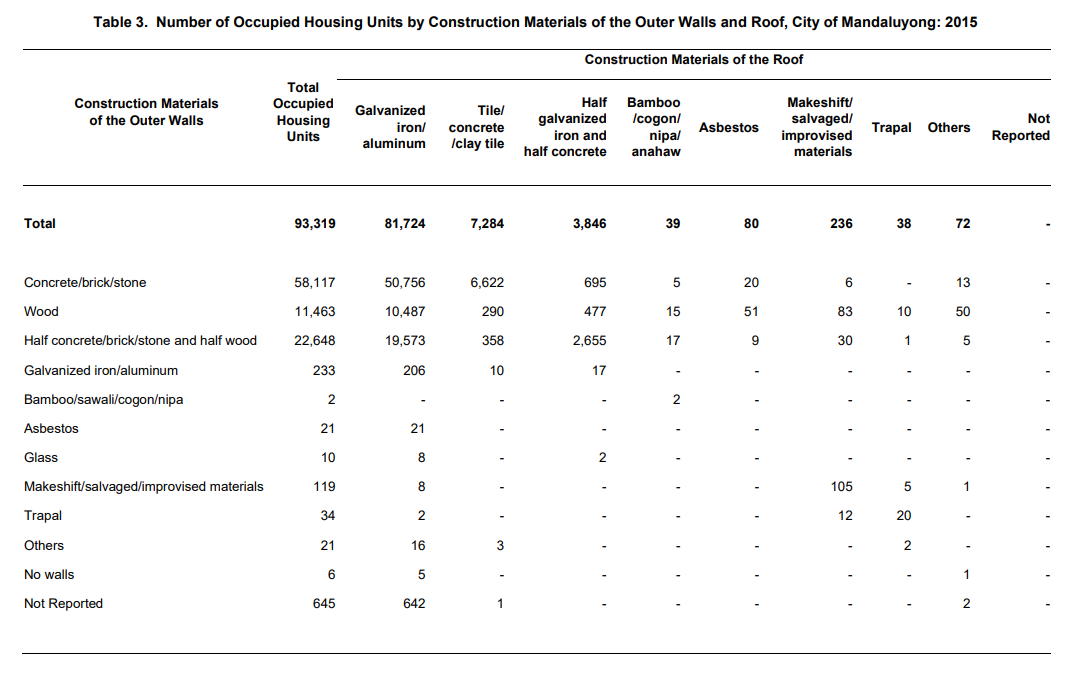
Approximately 99 percent of the housing units are built of strong walls and roofs
Walls of housing units are considered strong if it is made of concrete/brick/stone, wood, half concrete/brick/stone and half wood, galvanized iron/aluminum, asbestos, and glass. Likewise, roofs are strong if it is made of galvanized iron/aluminum, tile/concrete/clay tile, half galvanized iron and half concrete, and asbestos.
Out of 93,319 housing units, 92,492 (99.1%) had strong walls and 92,934 (99.6%) had strong roofs. The rests were made of bamboo/sawali/cogon/nipa, makeshift/salvaged/improvised materials, trapal, and others while some had no walls and had not reported walls and roofs.
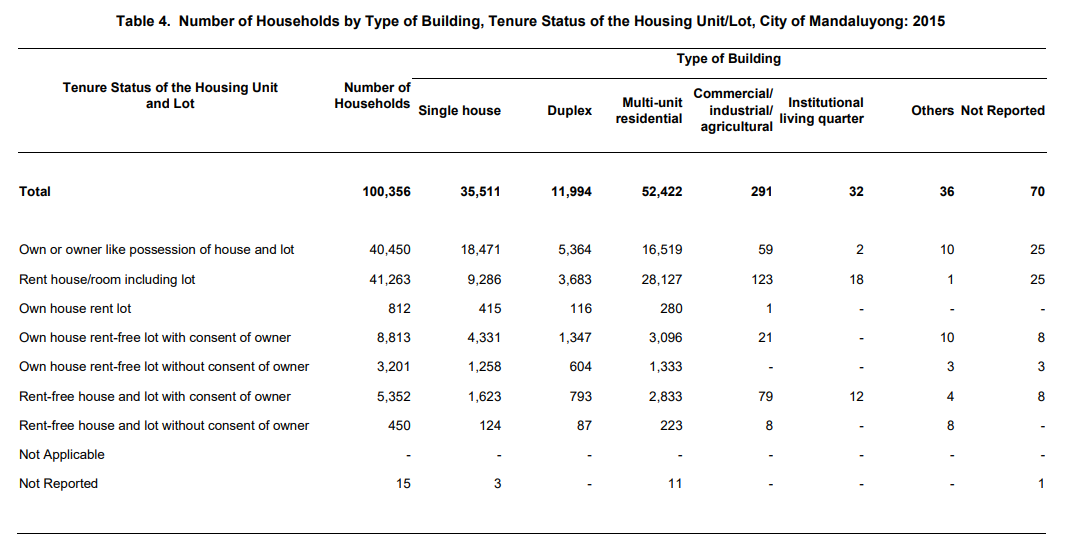
Four out of ten households are only renting
Based on the results of the 2015 Census of Population, most of the residents in the City of Mandaluyong were only renting house/room including lot or own-house but rent lot which accounted to 41.9 percent of the total number of households. The buildings being rented were mostly multi-unit residential and single houses.
On the other hand, the number of households who really owned or possessed a house and lot was 40,450 (40.3%). Same way, most of these owned properties were single houses and multi-unit residential.
Meanwhile, 3,651 (3.6%) households occupied houses or lots without the consent of the owner.
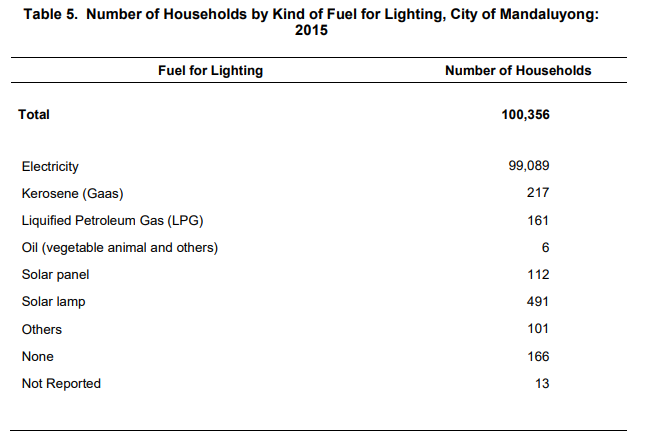
Households still rely on electricity as source of lighting
Majority of the households used electricity as a kind of fuel for lighting with a total of 99,089 or 98.7 percent of the total number of households.
People have now shifted with the technology through the usage of solar energy. It was reported that 603 households used solar panel and solar lamps. Solar energy was the second fuel mostly used by the households, followed by gases like kerosene and liquefied petroleum gas with 217 and 161, respectively.
On the other hand, some households were still using oil from vegetable, animals, and others. One hundred seven households had been reported who were using these kinds of fuel.
Meanwhile, 166 households do not use any and 13 had not been reported.
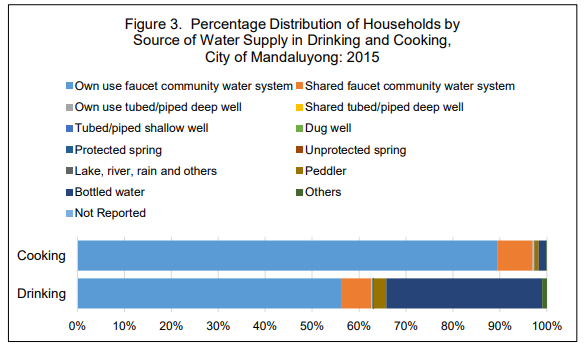
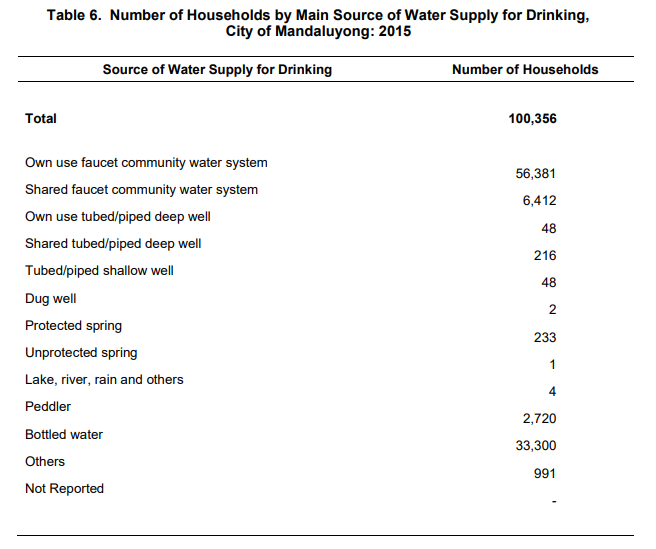
Majority of the households of the City of Mandaluyong drinks water from community water systems
Residents in the City of Mandaluyong used different sources of drinking water but majority of them used to drink water from community water systems, either owned or shared, with 62.6 percent. This was followed by bottled water with 33.2 percent.
Some residents got drinking waters from tubed/piped deep wells, either owned or shared, (0.3%); tubed/piped shallow (0.05); dug wells (0.002%); springs, either protected or not, (0.2%); lake, river, rain and others (0.004%); peddler (2.7%); and others (1.0%).
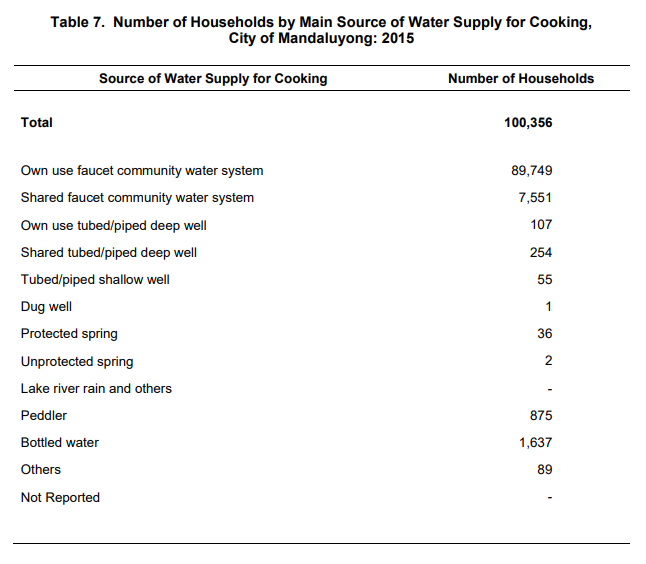
Aside from drinking, community water systems are commonly used for cooking too
Ninety-seven percent of households used community water systems as source of water for cooking, followed by bottled water and peddler with 1.6 and 0.9 percent, respectively.
(SGD.) Danilo R. Cubinar
Chief Statistical Specialist
| Attachment | Size |
|---|---|
|
|
180.24 KB |