Release Date :
Reference Number :
2023 –SR–13-002
The National Capital Region recorded a total population of 13,484,462 persons. Of this total, the household population comprised 99.4 percent or 13,403,551 persons. It increased by 615,882 persons increase from the 12,787,669 household population in the 2015 Census of Population (POPCEN 2015).
Of the household population in 2020, 49.8 percent, or 6.6 million were male while 50.2 percent or 6.7 million were females. By age group, 27.6 percent or 3.6 million were under 15 years of age (young dependent). On the other hand, persons aged 15 to 64 years (working age or economically active population) totaled 9.1 million or 67.7 percent while those in age groups 65 years and over (old dependents) comprised the remaining 634 thousand or 4.7 percent. In 2015, persons aged 0 to 14 years, 15 to 64 years, and 65 years and over accounted for 27.3, 68.7, and 3.9 percent of the household population, respectively.

Moreover, there were more males (72.9%) than females (69.5%) in the 0 to 39 age group. Meanwhile, among the older age group (40 years and over), females (30.5%) outnumbered males (27.1 %).
Sex ratio stands at 99 males per 100 females
The sex ratio in NCR was computed at 99 in 2020. This means that there were 99 males for every 100 females. The sex ratio in 2015 was slightly lower at 97 males per 100 females. (Figure 2)
In 2020, children aged below 15 years had a sex ratio of 107 males per 100 females, while those aged 15 to 64 years old had a sex ratio of 99 males to 100 females. Moreover, among those aged 65 years and over, the sex ratio was 65 males per 100 females. This depicts a longer life expectancy among females than males or a higher mortality rate among males than females in the age group 65 years old and over. (Figure 2)

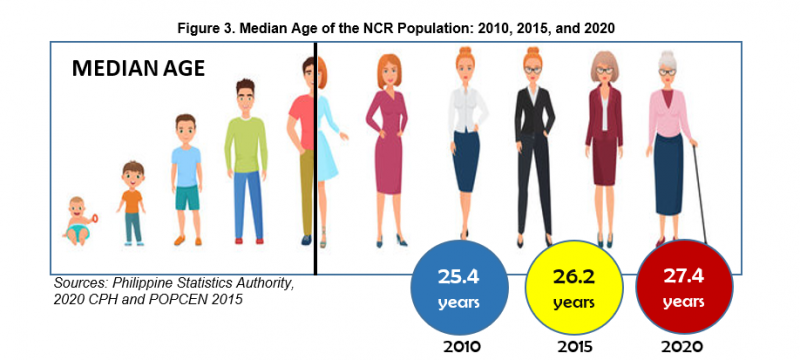
Median age increase to 27.4 years
In 2020, the median age of the household population was computed at 27.4 years, which means that half of the household population was younger than 27.4 years, while the other half is older than 27.4 years. This was higher than the median ages of 26.2 years and 25.4 years that were posted in 2015 and 2010, respectively. (Figure 3)
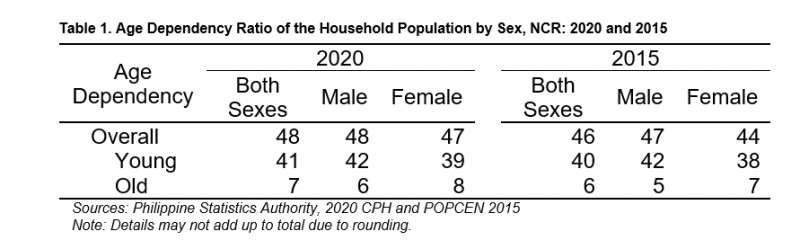
Young and Old dependents increase to 47 dependents per 100 persons in the working-age
The overall dependency ratio of the NCR was computed at 47, which indicates that for every 100 working-age or economically-active population, there were about 47 dependents (40 young dependents and 7 old dependents). This was higher than the dependency ratio in 2015, which was recorded at 45 dependents per 100 working-age household population (40 young dependents and 5 old dependents). (Table 1)
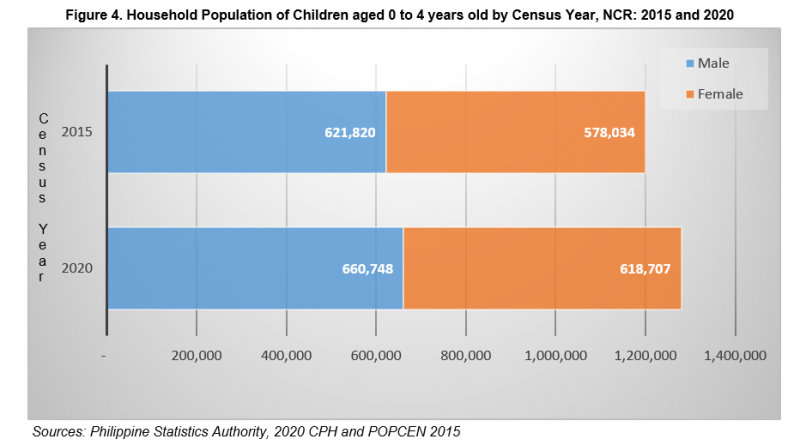
There are more males than females in children under five years old
Children below five years old comprised 1.3 million or 9.5 percent of the region’s household population. There were more males, 0.7 million (51.6%), than females, 0.6 million (48.4 %), in children under five years old resulting to a sex ratio of 107 males per 100 females in 2020. Meanwhile, the population of children under five years old was higher at 1.2 million with a sex ratio of 108 males per 100 females in 2015. (Figures 4)
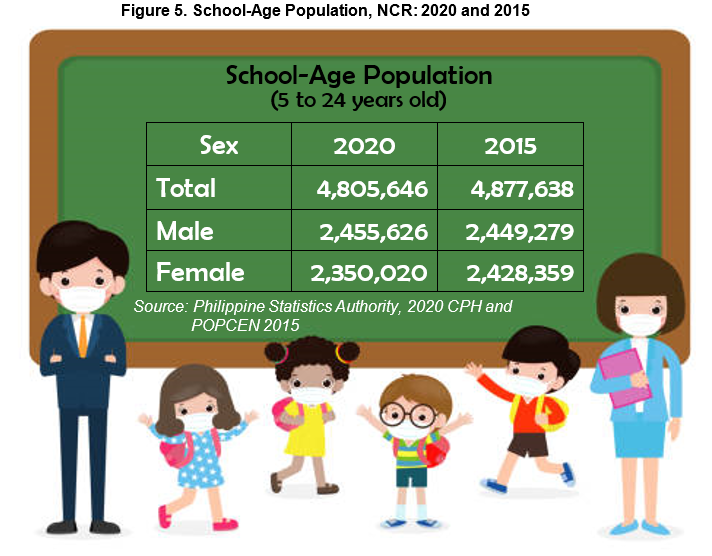
Decreased in the School-age Population in 2020
In 2020, the school-age population (5 to 24 years old) accounted for 4.8 million (35.9%) of the region’s household population. This was lower by 71,992 persons compared to the 4.8 million (38.1%) school-age population reported in 2015. Males in this age group got a bigger share of 51.1 percent compared to 48.9 percent of the females’ age group in 2020. (Table C and Figure 5)
Youth accounts for less than a third of the household population
Youth or persons whose age ranges from 15 to 30 years totaled 3.9 million or about 29.4 percent of the household population in 2020, lower than the 4.1 million (31.9 %) recorded in 2015. In the Philippines, individuals belonging to this age group considered of the voting age for the Sangguniang Kabataan in accordance with Republic Act No. 8044 (Sangguniang Kabataan Act of 2015). (Table C)
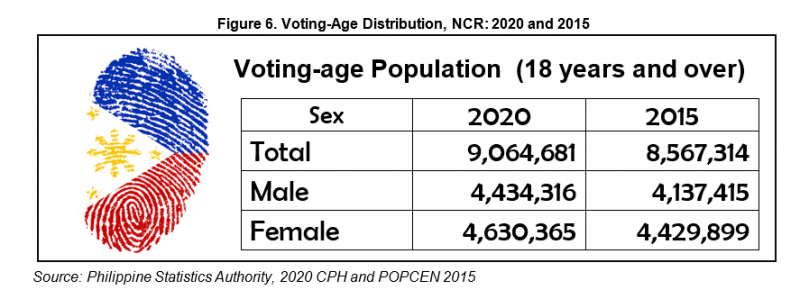
About 67 percent of the household population is of voting age
The voting-age population (18 years old and over) accounted for 67.6 percent or 9.1 million of the household population in 2020, up from 67.0 percent or 8.6 million in 2015. Women comprised about 51.1 percent (4.63 million) of the total voting population. (Table C and Figure 6)
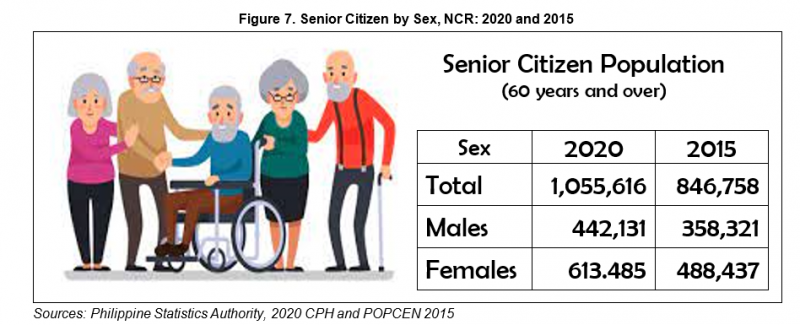
Senior citizens constitute 7.9 percent of the household population
In the Philippines, people aged 60 years old and over are regarded as senior citizens. They made up 7.9 percent (1.05 million) of the household population in 2020, higher than the 6.6 percent (846 thousand) recorded in 2015. There were more females (58.1%) than males (41.9%) among senior citizens in 2020. The same trend was observed in 2015. (Table C and Figure 7)
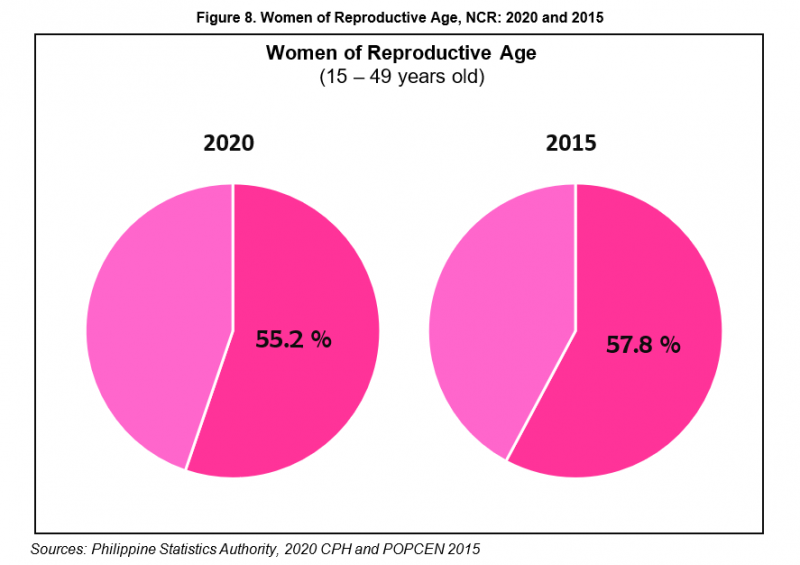
More than half of the female population is of reproductive age
Women of reproductive age (15 to 49 years old) totaled 3.7 million or 55.2 percent of the 6.7 million female households in 2020. These figures were lower compared with the 57.8 percent (3.7 million) posted in 2015. (Table C and Figure 8)
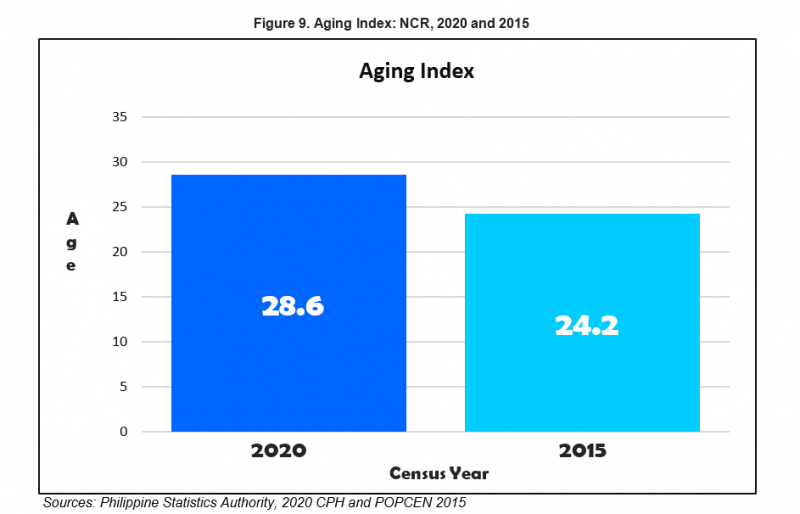
The aging index increased by 4.4 points from 24.2 in 2015 to 28.6 in 2020
In NCR, the aging index, or the proportion of persons aged 60 years and over per 100 persons under the age of 15 years was computed at 28.6 in 2020. This means that there is one person aged 60 years and over for every four children under 15 years old. The aging index in 2015 was 4.4 points lower at 24.2. (Table C and Figure 9)
SGD
PACIANO B. DIZON
Regional Director
TECHNICAL NOTES
I. Introduction
The Philippine Statistics Authority conducted the 2020 Census of Population and Housing (2020 CPH) in September 2020, with 01 May 2020 as the reference date.
The 2020 CPH was the 15th census of population and 7th census of housing that was undertaken in the Philippines since the first census in 1903. It was designed to take inventory of the total population and housing units in the country and collect information about their characteristics.
The Philippine Standard Geographic Codes as of April 2022 were used for the disaggregation of geographic levels of the 2020 CPH.
II. Definition of Terms and Concepts
Household is a social unit consisting of person or a group of persons who sleep in the same housing unit and have a common arrangement in the preparation and consumption of food.
Household population refers to all persons who are members of the household.
Sex is the biological and physiological reality of being a male or female.
Age refers to the interval of time between the person’s date of birth and his/her last birthday prior to the census reference date. It is expressed in completed years or whole numbers.
Age-sex structure is the composition of a population as determined by the number or proportion of males and females in each age category. The age-sex structure of a population is the cumulative result of past trends in fertility, mortality, and migration. Information on age-sex composition is essential for the description and analysis of many other types of demographic data.
Population pyramid is a bar chart, arranged vertically, that shows the distribution of a population by age and sex. By convention, the younger ages are at the bottom, with males on the left and females on the right.
Sex ratio is the number of males per one hundred females in a population.
Overall dependency ratio is the number of persons under 15 years old (young dependents) and persons aged 65 and older (old dependents) per one hundred persons 15 to 64 years old (working-age or economically-productive group) in a population.
Aging of population is a process in which the proportions of adults and elderly increase in a population, while the proportions of children and adolescents decrease. This process results in a rise in the median age of the population. Aging occurs when fertility rates decline while life expectancy remains constant or improves at the older ages.
Aging index is calculated as the number of persons 60 years old and over per one hundred persons under the age of 15 years.
| Attachment | Size |
|---|---|
|
|
711.47 KB |
|
|
25.13 KB |